Written by AaronApril 11, 2024
How to Make a Pie Chart in Google Sheets
Create . google docs Article
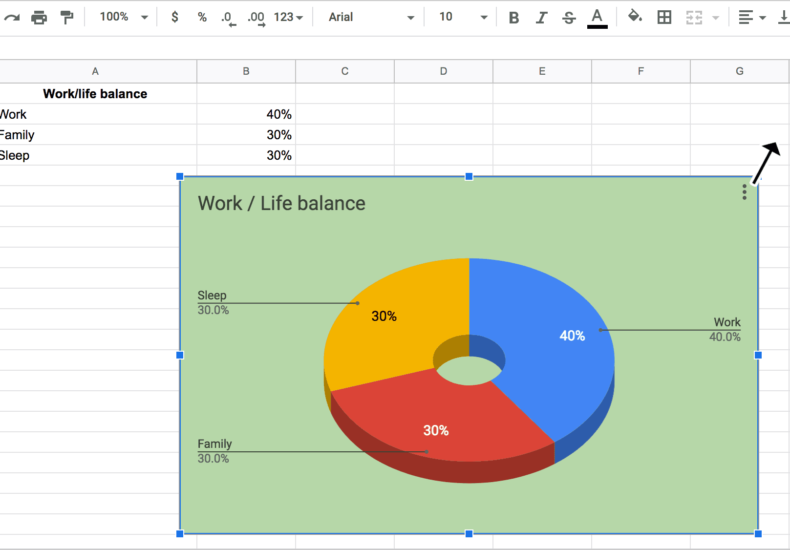
A pie chart (or a circle chart) is a graphical representation of data that looks like a circle is divided into sectors each of which represents a proportion of the whole. You can use Google Docs to design pie charts for free. Google Spreadsheets can be an easy and free graph maker for you allowing
Archives
Calendar
| M | T | W | T | F | S | S |
|---|---|---|---|---|---|---|
| 1 | 2 | 3 | 4 | 5 | 6 | 7 |
| 8 | 9 | 10 | 11 | 12 | 13 | 14 |
| 15 | 16 | 17 | 18 | 19 | 20 | 21 |
| 22 | 23 | 24 | 25 | 26 | 27 | 28 |
| 29 | 30 | |||||